Johnson To

Personal project, January to May 2026

Faradaic efficiency of hydrogen evolution in a bicarbonate electrolysis cell

I built a two-electrode water electrolysis cell with graphite electrodes in aqueous NaHCO₃ and ran 18 constant-voltage trials from 4.0 to 6.5 V (n = 3 per condition). Hydrogen evolved at the cathode was collected by water displacement and compared with the yield predicted by Faraday's law from the measured current. Faradaic efficiency peaked at 87.7 ± 0.6% at 5.5 V.

Peak Faradaic efficiency (5.5 V)
88%
Trials (n = 3 per voltage)
18
Applied cell voltage
4.0–6.5 V
R², H₂ volume vs. current
0.991

Try the model

Measured H₂, one point per trial Faradaic yield (100% efficiency). Hover a point for trial data.

Experimental methods

Undivided two-electrode cell, constant-voltage operation from a DC bench supply, volumetric gas collection over each electrode.

Experimental design

  • ElectrodesGraphite rods (cathode and anode)
  • ElectrolyteAqueous NaHCO₃, 500 mL
  • Independent variableCell voltage, 4.0 to 6.5 V in 0.5 V steps
  • Duration60 s per trial
  • Replicatesn = 3 per voltage, 18 total
  • Dependent variablesCell current; H₂ volume by water displacement
  • ControlledElectrolyte volume, run time, electrode material
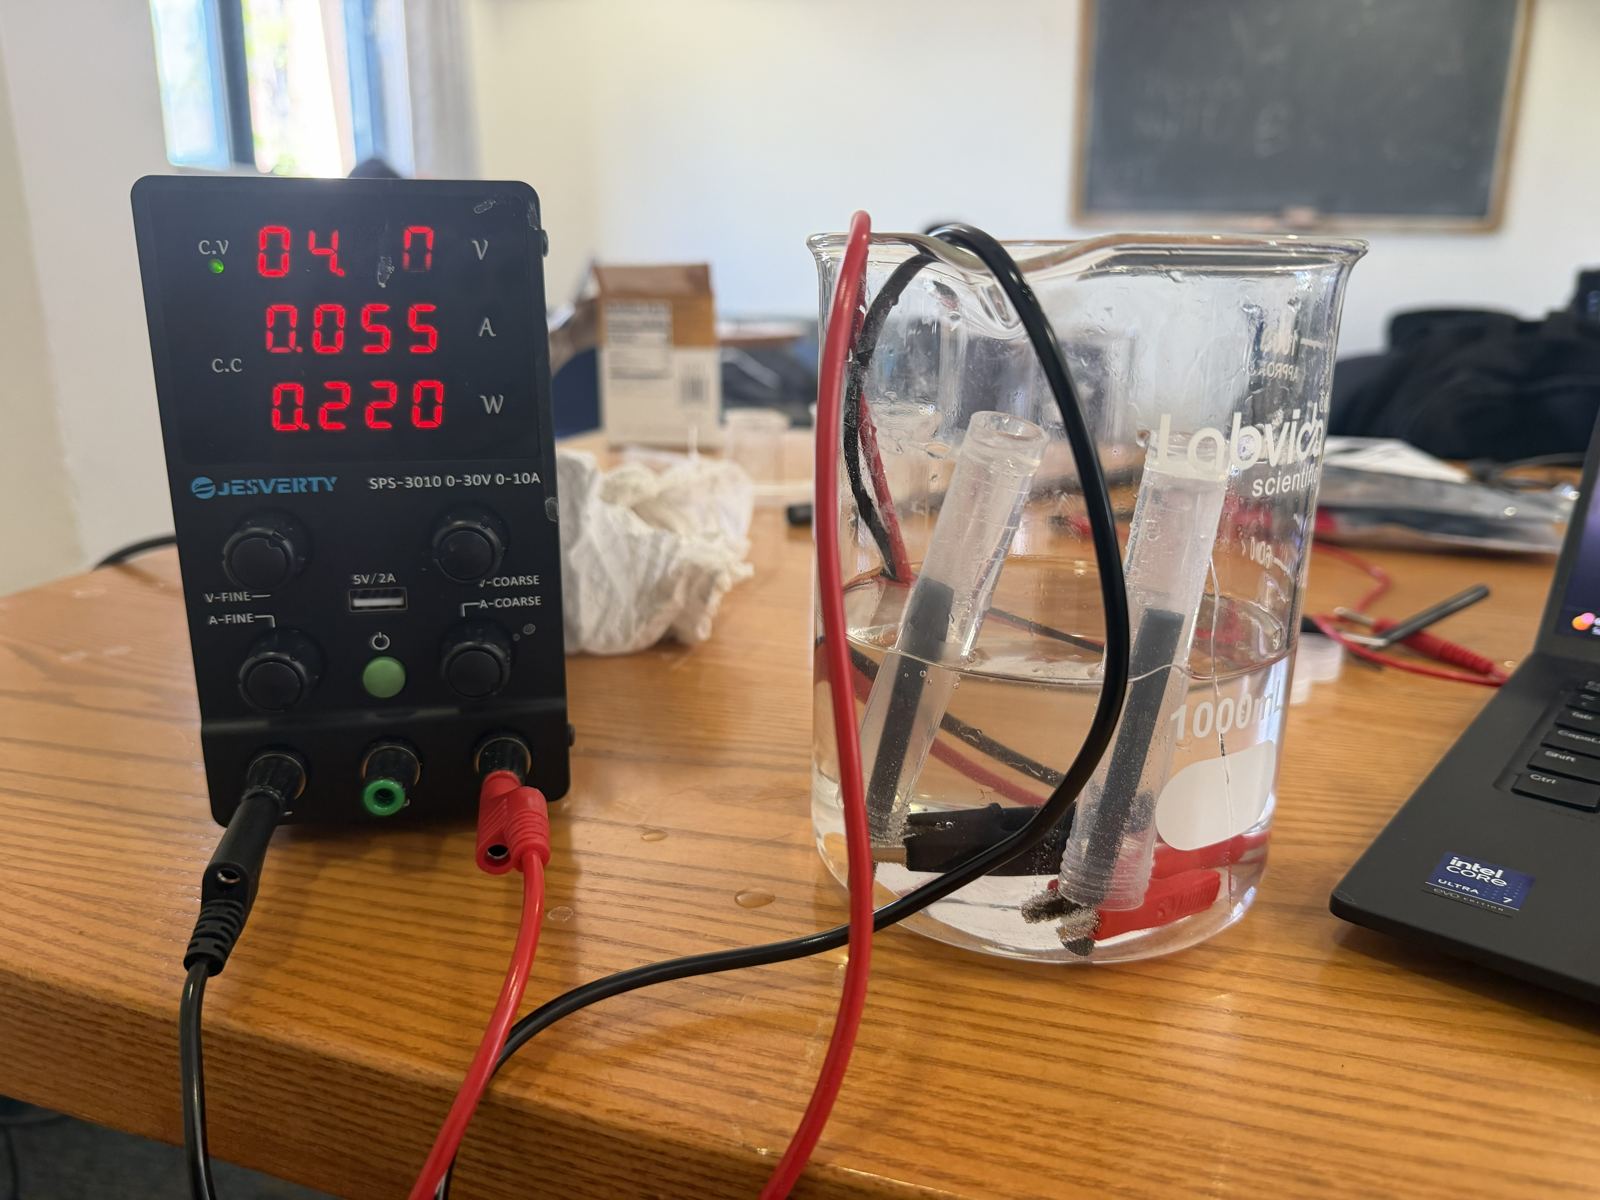
Bench power supply reading 4.0 volts and 0.055 amps, wired with red and black leads to two graphite electrodes in a beaker of electrolyte with inverted collection tubes.
Apparatus during a 4.0 V run; the supply reads 0.055 A.
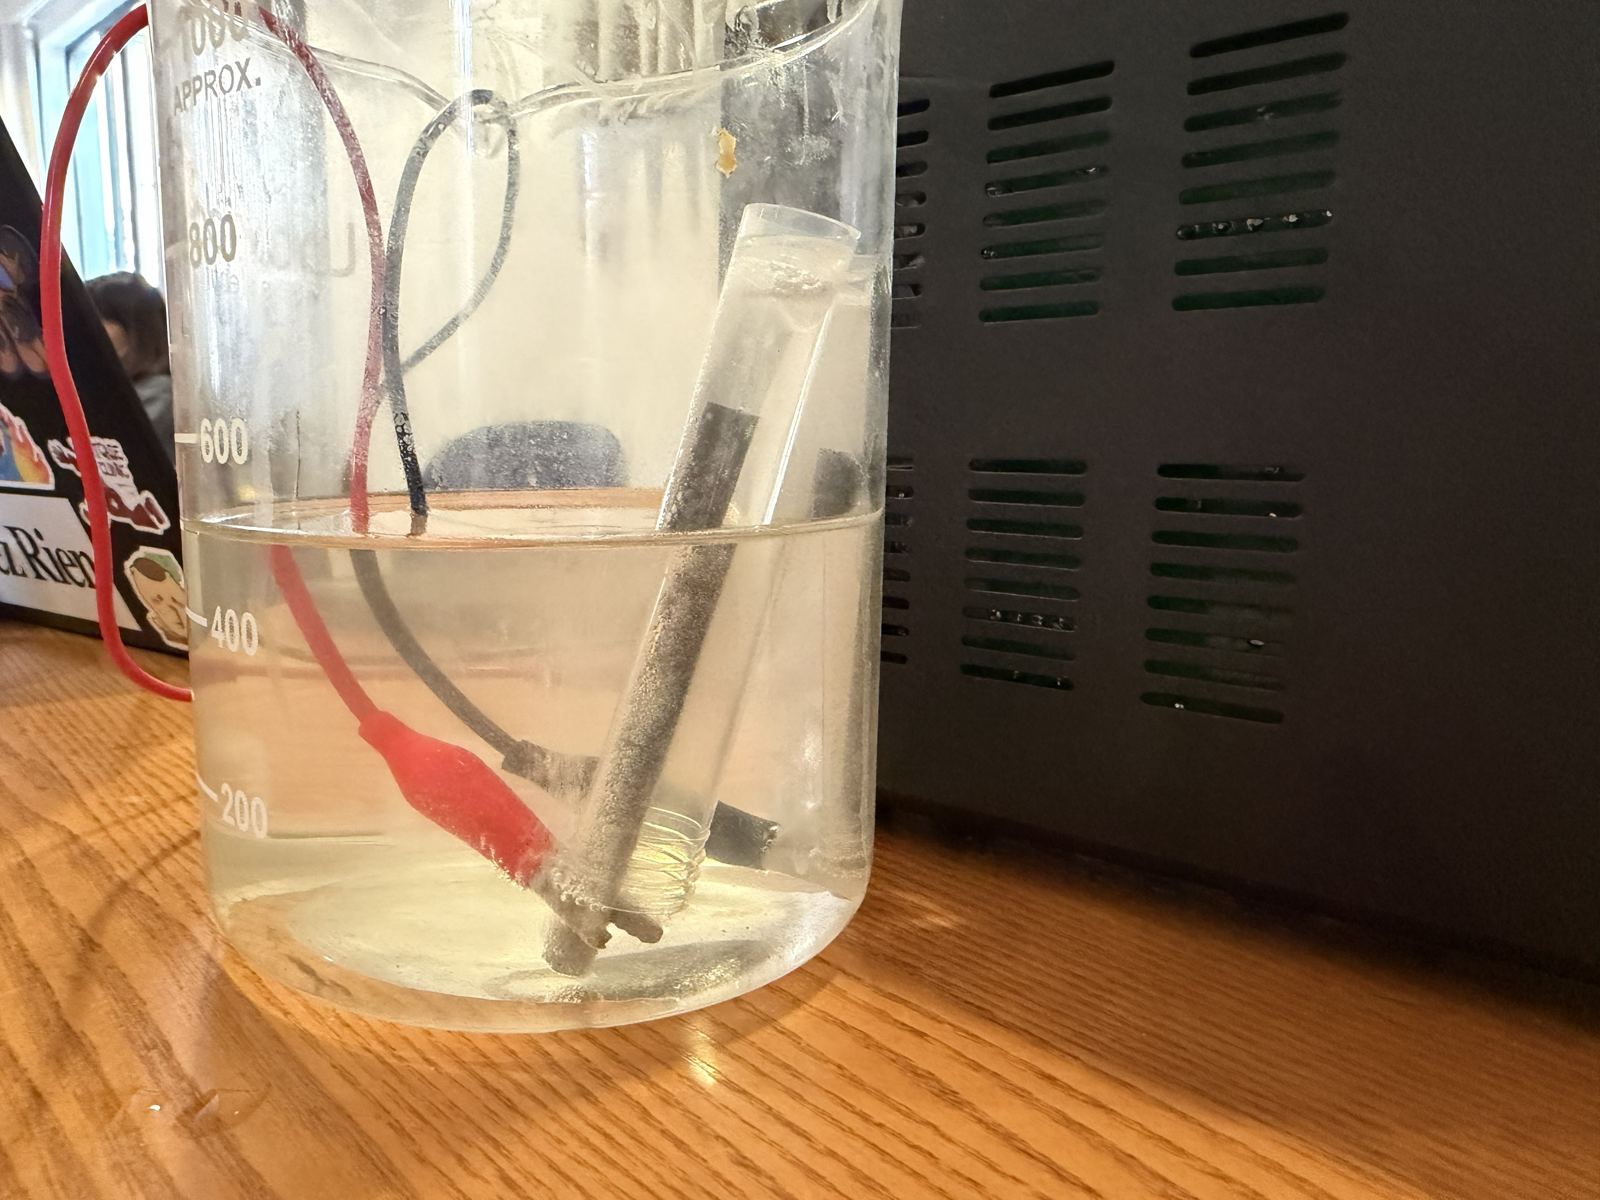
Close-up of a graphite electrode inside a gas collection tube in the electrolyte, with small bubbles on the electrode surface.
Gas evolution at the graphite cathode and collection in the inverted tube.

Electrolyte selection

Preliminary runs in water without added electrolyte produced negligible gas. Water's low ionic conductivity gives a large ohmic (iR) drop, so almost no current flowed at these voltages. Adding NaHCO₃ as a supporting electrolyte raised conductivity enough for sustained gas evolution; all recorded trials use this electrolyte. The preliminary runs were observed qualitatively and are not included in the data.

Theory

The hydrogen evolution reaction (HER) consumes two electrons per H₂, so the charge passed sets the maximum yield.

Cathode2H₂O + 2e⁻ → H₂ + 2OH⁻

Anode2H₂O → O₂ + 4H⁺ + 4e⁻

Overall2H₂O → 2H₂ + O₂

Applied voltage affects hydrogen output only through current. Raising the cell voltage further above the sum of the reversible potential and the cell's losses increases current; at fixed duration, charge scales with current; and by Faraday's law, H₂ yield scales with charge. H₂ volume vs. current is therefore the most direct test of the model.

VH₂=I · t2F·Vm

I = current, t = duration, F = 96,485 C/mol (Faraday constant), Vm = 24.0 L/mol (ideal-gas molar volume near 20 °C and 1 atm). Faradaic efficiency is the ratio of measured to predicted H₂ volume.

Sample calculation: trial 12, 5.5 V

  1. Charge passed0.126 A × 60 s = 7.56 C
  2. Moles of electrons7.56 C ÷ 96,485 C/mol = 7.84 × 10⁻⁵ mol
  3. Moles of H₂ (2 e⁻ each)3.92 × 10⁻⁵ mol
  4. Predicted volume3.92 × 10⁻⁵ mol × 24,000 mL/mol = 0.940 mL
  5. Measured volume0.830 mL
  6. Faradaic efficiency0.830 ÷ 0.940 = 88.3%

Highest single-trial efficiency of the 18 runs.

Results

Values are mean ± SD, n = 3; fit parameters are ± one standard error.

Measured, with least-squares fit Faradaic prediction

H₂ yield is linear in current, with a slope at 90% of theory

A least-squares fit of H₂ volume against current over all 18 trials gives a slope of 6.74 ± 0.16 mL/A for a 60 s run (R² = 0.991). Faraday's law predicts 7.46 mL/A, so the marginal Faradaic efficiency is 90 ± 2%.

The fitted intercept, −0.073 ± 0.022 mL, is significantly below zero. This indicates a current-independent loss in every run, consistent with H₂ dissolving into the electrolyte and gas retained as bubbles adhering to the electrode. A fixed loss is a larger fraction of a small collected volume, which accounts for the low efficiency of the 4.0 V runs (mean 0.28 mL collected).

Individual trials Mean (n = 3)

Efficiency reaches a maximum at 5.5 V

Mean Faradaic efficiency rose monotonically from 66.1 ± 3.5% at 4.0 V to 87.7 ± 0.6% at 5.5 V. At 6.0 and 6.5 V, vigorous gas evolution carried bubbles past the mouth of the collection tube (recorded in the notes for all six trials), and efficiency fell to 82.1 ± 0.3% and 84.6 ± 3.2%.

The decline above 5.5 V reflects a collection loss rather than a change in the electrochemistry. For this apparatus, 5.5 V maximizes measured efficiency; higher voltages raise the production rate at the cost of collection efficiency.

Measured current Linear fit, extrapolated to zero current

Extrapolated onset voltage is about 3.1 V

Current increased linearly with cell voltage over the tested range, with a slope of 0.057 ± 0.002 A/V (R² = 0.974). Extrapolating the fit to zero current gives an apparent onset voltage of about 3.1 V.

The thermodynamic minimum for water splitting is 1.23 V. The additional ~1.9 V is attributable to activation overpotentials for the HER and the oxygen evolution reaction (OER) on uncatalyzed graphite, plus ohmic losses in the dilute bicarbonate electrolyte. The inverse of the slope, about 17 Ω, approximates the total cell resistance in this range. Commercial alkaline electrolyzers reduce both losses with concentrated KOH and nickel-based electrodes.

Model

Voltage balance V = Erev + ηa + ηc + I·RΩ, solved for current. Dashed curves stay at the experimental conditions. Model notes

Current
–
H₂ rate
–
H₂ in 60 s
–
Voltage efficiency
–
Energy per kg H₂ at 100% / 90% Faradaic
–
Model Experimental conditions Measured
Model, 100% Model, 90% Measured
Reversible Activation (both electrodes) Ohmic (I·RΩ)

Assumptions

  • fitted Fitting to the measured trials…
  • 20 °C assumed, so Erev = 1.233 V and Vm = 24.0 L/mol.
  • Bare 6 mm graphite rods, 50 mm immersed, spacing center to center. Tubes and clips are not modeled.
  • Butler–Volmer kinetics, α = 0.5 (116 mV/decade), same j₀ at both electrodes.
  • RΩ for two parallel rods in a large bath; conductivity from an extended Onsager equation.
  • Model H₂ at 100% Faradaic efficiency. Gas loss above 5.5 V is not modeled.

Where the model and data disagree

Modeled current is within – of the measured mean at every voltage, inside the replicate spread from hand-set spacing. Measured H₂ falls below the 90% line at every voltage: most at 4.0 V, where the fixed loss per run seen in Results dominates, and again above 5.5 V, where gas escaped the tubes. The fitted concentration is an effective value that also absorbs current paths through the collection tubes and clips, so it may differ from what was mixed.

Run the experiment

Set the supply, then press Run for a 60 s trial like the ones in the data. The cell follows the model above: H₂ collects over the cathode and O₂ over the anode at half the volume.

Time
0.0 s
Charge passed
0.00 C
H₂ collected
0.00 mL
O₂ collected
0.00 mL

Error analysis

All 18 trials fell below the Faradaic prediction, so the dominant errors are systematic and negative. Likely sources:

  1. Collection loss at high current. At 6.0 and 6.5 V, bubbles were observed escaping past the collection tube, which accounts for the efficiency decline above 5.5 V.
  2. Current-independent loss. The −0.073 mL intercept indicates a fixed loss per run, consistent with H₂ dissolution and bubble adhesion. It amounts to about 17% of the predicted yield at 4.0 V and 5% at 6.5 V.
  3. Electrode spacing. Spacing was set by hand and not fixed between runs. Smaller spacing lowers ohmic resistance and visibly increased current, contributing to the 5–16% spread in current among replicates at each voltage.
  4. Volumetric resolution. 13 of 18 runs collected under 1 mL, so a fixed reading uncertainty is a large relative error.
  5. Current drift. Current can vary during a run, but charge was computed from a single current reading per trial rather than by integrating I(t).

Data

Mean ± standard deviation of three trials at each voltage. Processed in Python (pandas); every chart on this page is generated from the same CSV.

Summary by voltage
Voltage (V)Current (A)H₂ measured (mL)H₂ predicted (mL)Efficiency (%)
Loading data…
All 18 trials with notes
All trials
TrialVoltage (V)Current (A)H₂ (mL)Predicted (mL)Efficiency (%)Notes

Download: raw data (CSV), processed data (CSV), analysis script (Python)